 Thorsten Pawletta,
Hochschule Wismar - University of Technology, Business & Design
Final Year Project (Diploma Thesis)
Title : Simulation of Assembly Operations
|
Author: |
|
|
Supervisor: |
Prof. Dr.
T. Pawletta (HS Wismar) |
Simulation plays a more and more important role in modern manufacturing industry. It offers the opportunity to assume the performance of a system without building it in reality and thereby is an ideal tool for optimisation of a system or product in early stages at low costs.
Aims of this project were to:
During the first part the
general approach of modelling with WITNERSS® was investigated. Parallel small case studies were carried out in order to test the ability to model real problems and to get experiences in using the software.
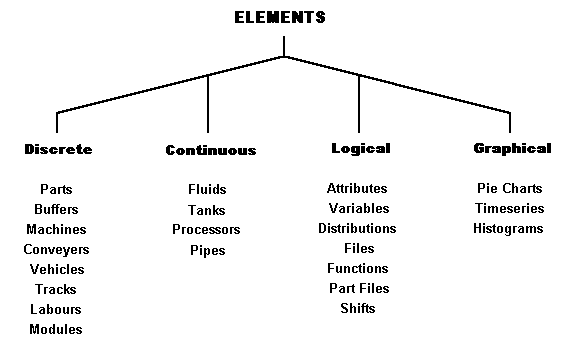
Figure 1: WITNESS elements and element groups
But there also were some restrictions in using the syntax detected that make modelling of particular situations more difficult than it should be. There were some more points discovered that could be improved to relieve modelling, but no more real limitations. If the model in principle is developed, completing it becomes a straightforward task.
This project only treated the main package of WITNESS® and did not use the virtual reality module or the optimiser. But even the two-dimensional representation contains various facilities to display the model layout and its dynamically behaviour. WITNESS® also provides an enormous set of predefined tables to present the outcomes of a simulation run or experiment, respectively. Due to its compatibility to standard formats the data easily may be processed in spreadsheet software.
During this project WITNESS® was confirmed as suitable simulation software and can be strongly recommended for simulation of manufacturing processes.
Largest part of the project was to
build a representative model of the MT75 assembly line of the FORD Halewood transmission plant. Figure 2 shows the general layout of the assembly line.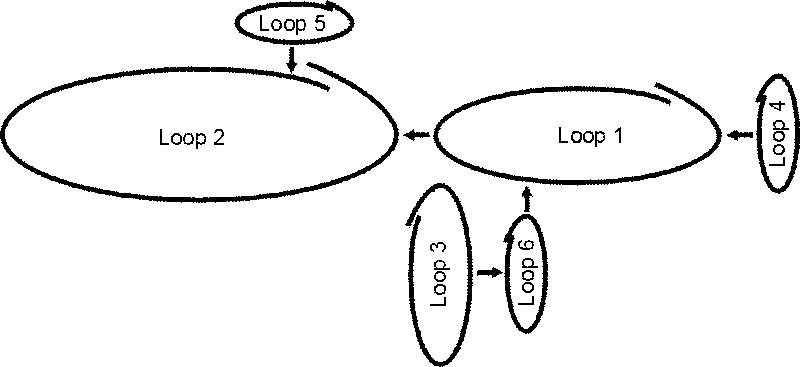
Figure 2: General line layout
The main modelling approach resulted form the preceding investigation of WITNESS® , where a machine & conveyor system was selected as most suitable. Throughout the modelling process this decision was confirmed. According to this each loop is made of a sequence of machine-elements to represent a workstation and conveyor-elements to represent the conveyor that connects two workstations. Figure 3 shows an example of modelling of one loop.
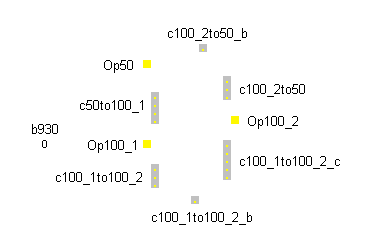
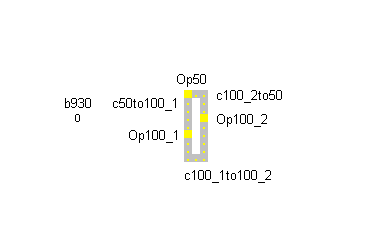
Figure 3: Modelling of loop 4
A stepwise modelling approach consisting of the following steps was selected:
Unfortunately there were some problems with collection of data – it was quite easy to get access to accumulated data, but the data already collected by FORD during last years were no further processed and partly incomplete. The time period of this project was to short to accumulate these data, so that the given data were used in the model. Whenever it was possible data were collected direct on the line and processed to be used in the model.
Input data into the model were:

Figure 4: Example of occurrence of cycle time at manual workstations
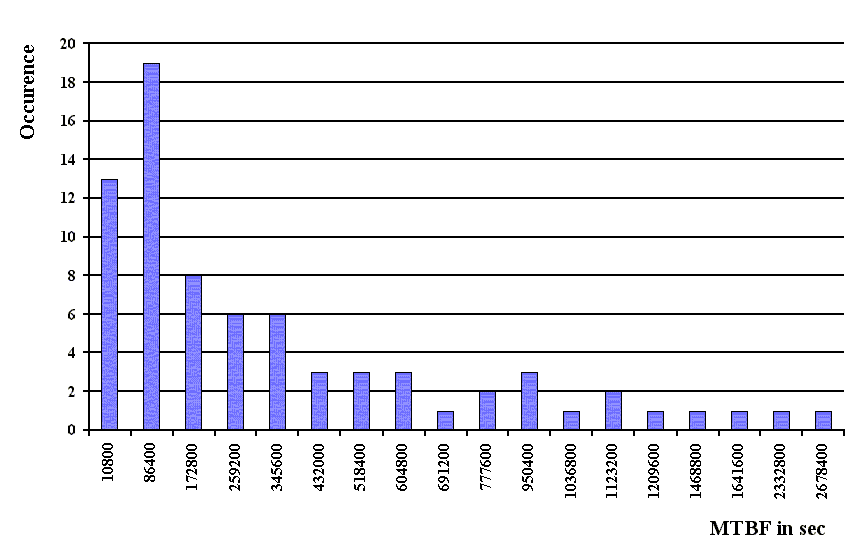
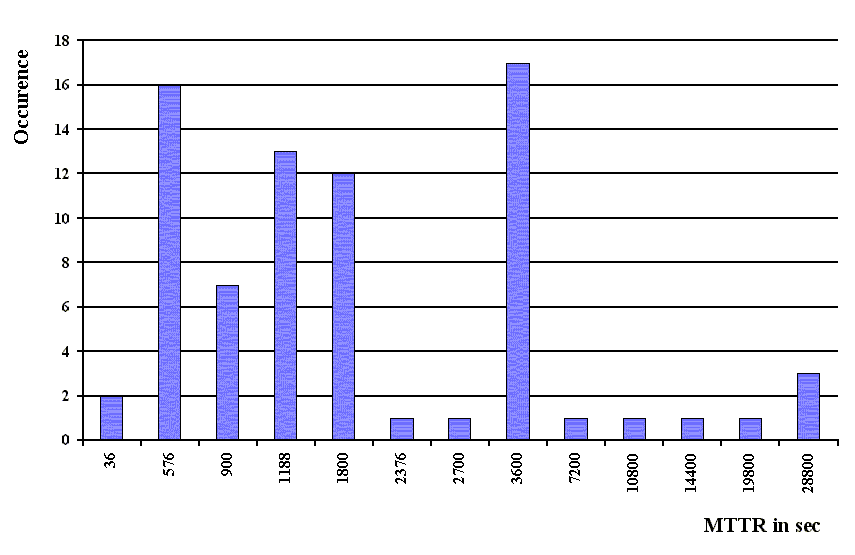
Figure 5: Example of MTBF and MTTR distribution
Modelling the assembly line was made harder through some demanding problems (e.g. dedicated robot control logic, batch working of assembly machines, handling of defective parts) that needed sophisticated solutions. But at least each problem could be solved in an appropriate manner. During modelling it was taken into account that the model might be enlarged in future (with improved data) and hence areas were modelled, even if they were not used by the current version. Additionally comments were attached to most elements, describing its role in the model and in the real world system, respectively, and containing some main data. This will make future understanding of the model by other people in order to improve it much easier.
The finished model of the original version was
verified and validated and its suitability to represent the real world system confirmed. Applied verification and validation techniques are:Because of their heavy impact on the entire line performance (see figure 6) it was decided to run
experiments without breakdown and set-up operations. Through this the outcomes became more clear and easier to interpret.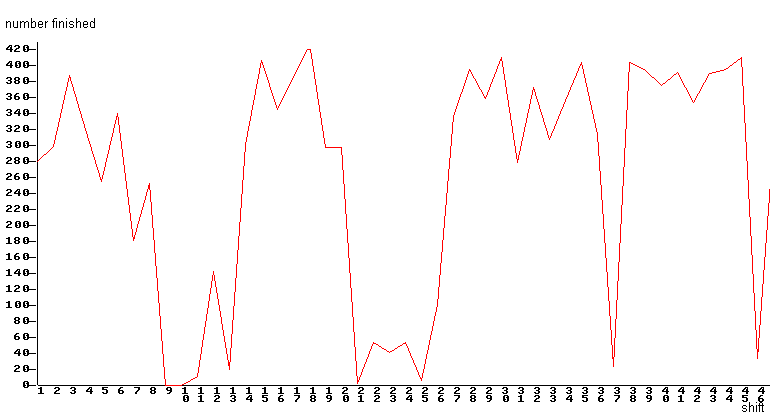

Figure 6: Outcome per shift with and without simulated breakdowns à (without numbers)
The design of the experiments (scenarios) itself was based on a systematic approach were the results of one experiment determined the changes to make in the next, where changes included:
The experimentation phase ended as the utilisation of the two workers at the most time consuming operation on the line nearly reached 100%. This ending condition can be seen as appropriate, because aim of this project – to optimise the assembly line for future planned volumes – is clearly reached.
As result of the experiments the number of finished transmissions per shift could be enhanced by remarkable 17% and thereby the utilisation of the worker much more equalised than it was before. This result is as more impressive as the changes, which are recommended to make are quite simple and cheap to do:
This project did not considered changes like:
In order to further improve the line efficiency it is recommended to consider these things in future projects. Some detailed recommendations for future projects were made.
The results of this project were presented to FORD personnel and discussed in a final audit, where the feasibility of the proposed changes and satisfaction with the line improvements were confirmed.